
 Add Photo
Hello, I'm
Data Analyst · Power BI Developer · SQL Analyst
Detail-oriented Data Analyst with a strong foundation in data cleaning, exploratory data analysis, and data visualization using Excel, SQL, Tableau, and Power BI. Skilled in transforming raw datasets into actionable insights that support data-driven business decisions.
I'm a certified Data Analyst with a passion for uncovering the story hidden inside every dataset. My journey into data analysis was sparked by an enduring curiosity about how businesses truly function-specifically the complex world of large-scale retail.
I found myself asking fundamental questions: How do these organizations determine which products will resonate with their customers? How do they accurately predict demand before stocking their shelves? Beyond just the volume of sales, how do they distinguish between moving inventory and generating real, sustainable profit?.
To answer these questions, I immersed myself in the world of data analytics, learning to clean, analyze, and visualize data to extract actionable insights. I discovered that the key to effective decision-making lies in understanding the underlying patterns and trends that drive business performance.
Also, this desire to peek behind the curtain and understand the mechanics of business decision-making is what led me to data analysis. I don't just want to see the numbers; I want to understand the story they tell and use those insights to help businesses thrive.
I hold a certification from TechVerve ICT Academy - One of the leading institutions in data science education and technology education and Great Learning Academy. I have applied those skills to real-world projects spanning sales analysis, HR reporting, financial forecasting, and customer behaviour analytics.
My goal is to join a data-driven team where I can contribute immediately while continuing to grow — particularly in predictive analytics and machine learning applications.
Techverve ICT Academy
Techverve ICT Academy
Techverve ICT Academy
Great Learning Academy
PivotTables, Power Query, complex formulas, VLOOKUP/XLOOKUP, data modelling, Charts, Data Cleaning
AdvancedSELECT, JOIN, GROUP BY, Filtering, Data Extraction
AdvancedDAX, Dashboard Creation, data modelling, interactive dashboards, Power Query, report design
AdvancedCalculated fields, LOD expressions, story points, Tableau Public, Interactive Dashboards, Data Visualization
IntermediateReal-world data problems, end-to-end solutions.
•Queried relational databases to extract meaningful business information.
• Used SQL operations including SELECT, JOIN, filtering, and GROUP BY.
• Analyzed structured datasets to identify trends and relationships
• Analyzed over 1,000 financial transactions to identify suspicious transaction patterns.
• Applied analytical techniques to detect unusual customer behaviors and risk indicators.
• Performed customer risk segmentation based on transaction activity.
• Identified high-risk transaction periods and fraud-prone activities.
• Generated insights and recommendations for improving transaction monitoring processes.
.
• Cleaned and organized customer datasets for accurate analysis.
• Analyzed customer purchasing behavior and revenue drivers.
• Created reports and visual summaries to support business decisions
• Analyzed retail sales data to identify revenue trends, product performance, and regional sales patterns.
• Designed an interactive Tableau dashboard to visualize sales and profit metrics.
• Extracted business insights to support profitability improvement strategies.
• Presented findings through clear data storytelling and visualization
.
Multi-page Power BI report monitoring inventory turnover, supplier performance, and logistics costs for a manufacturing client with 500+ SKUs.
Fully interactive reports — filter, drill down, and explore the data yourself.
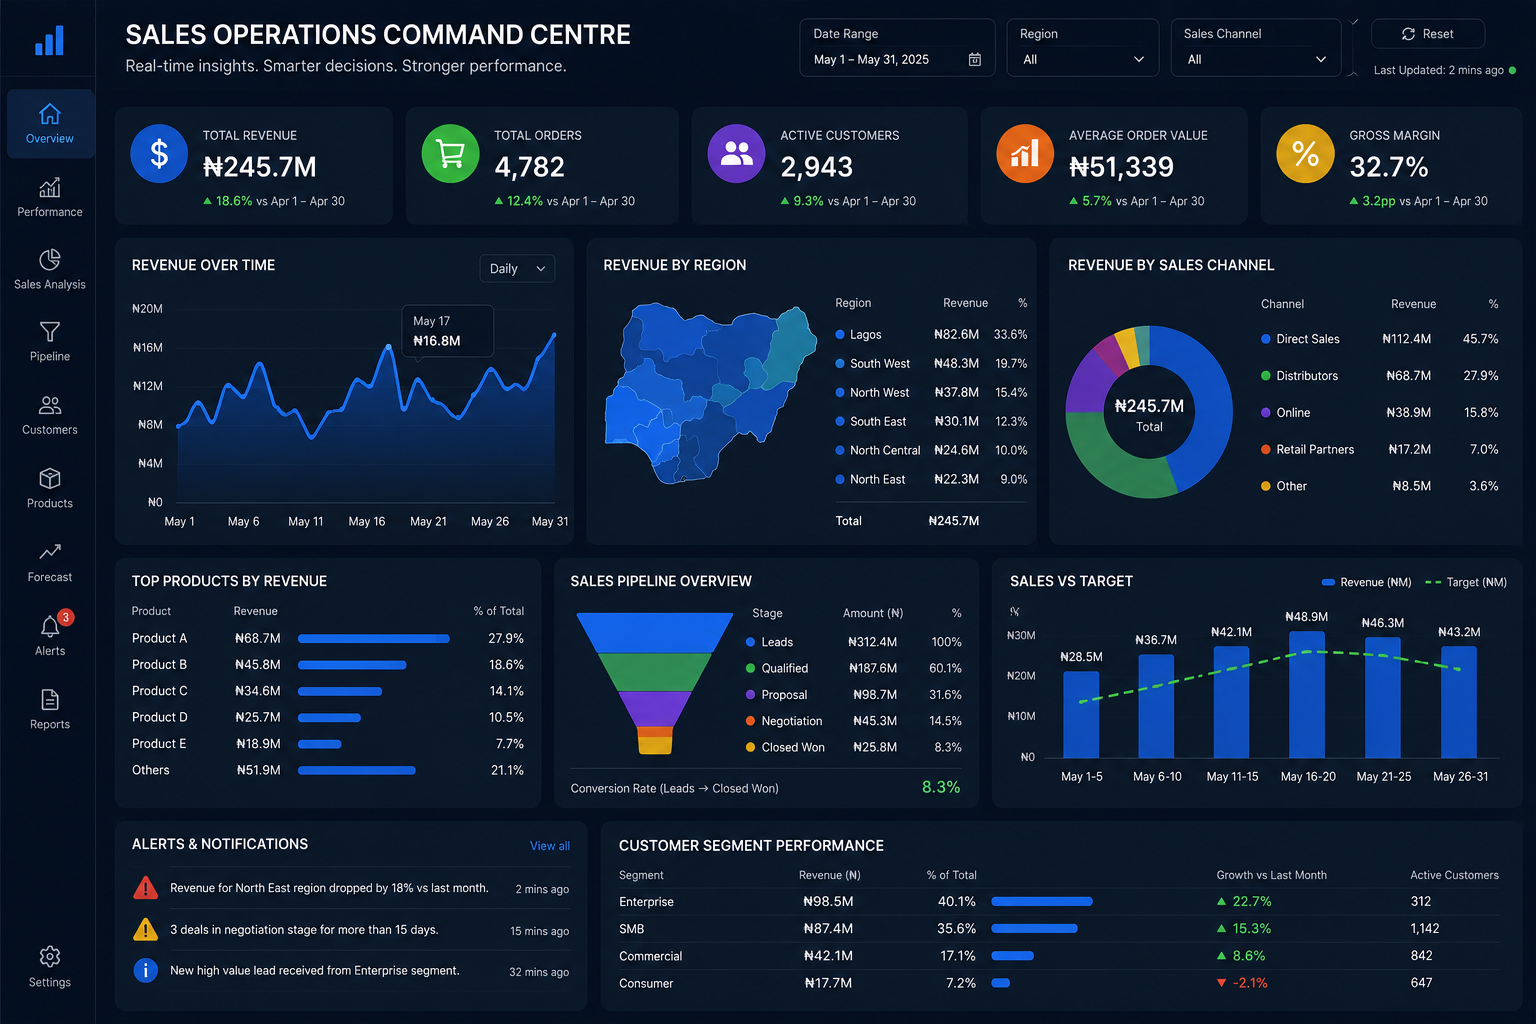
Published on Tableau Public — explore and interact directly in your browser.
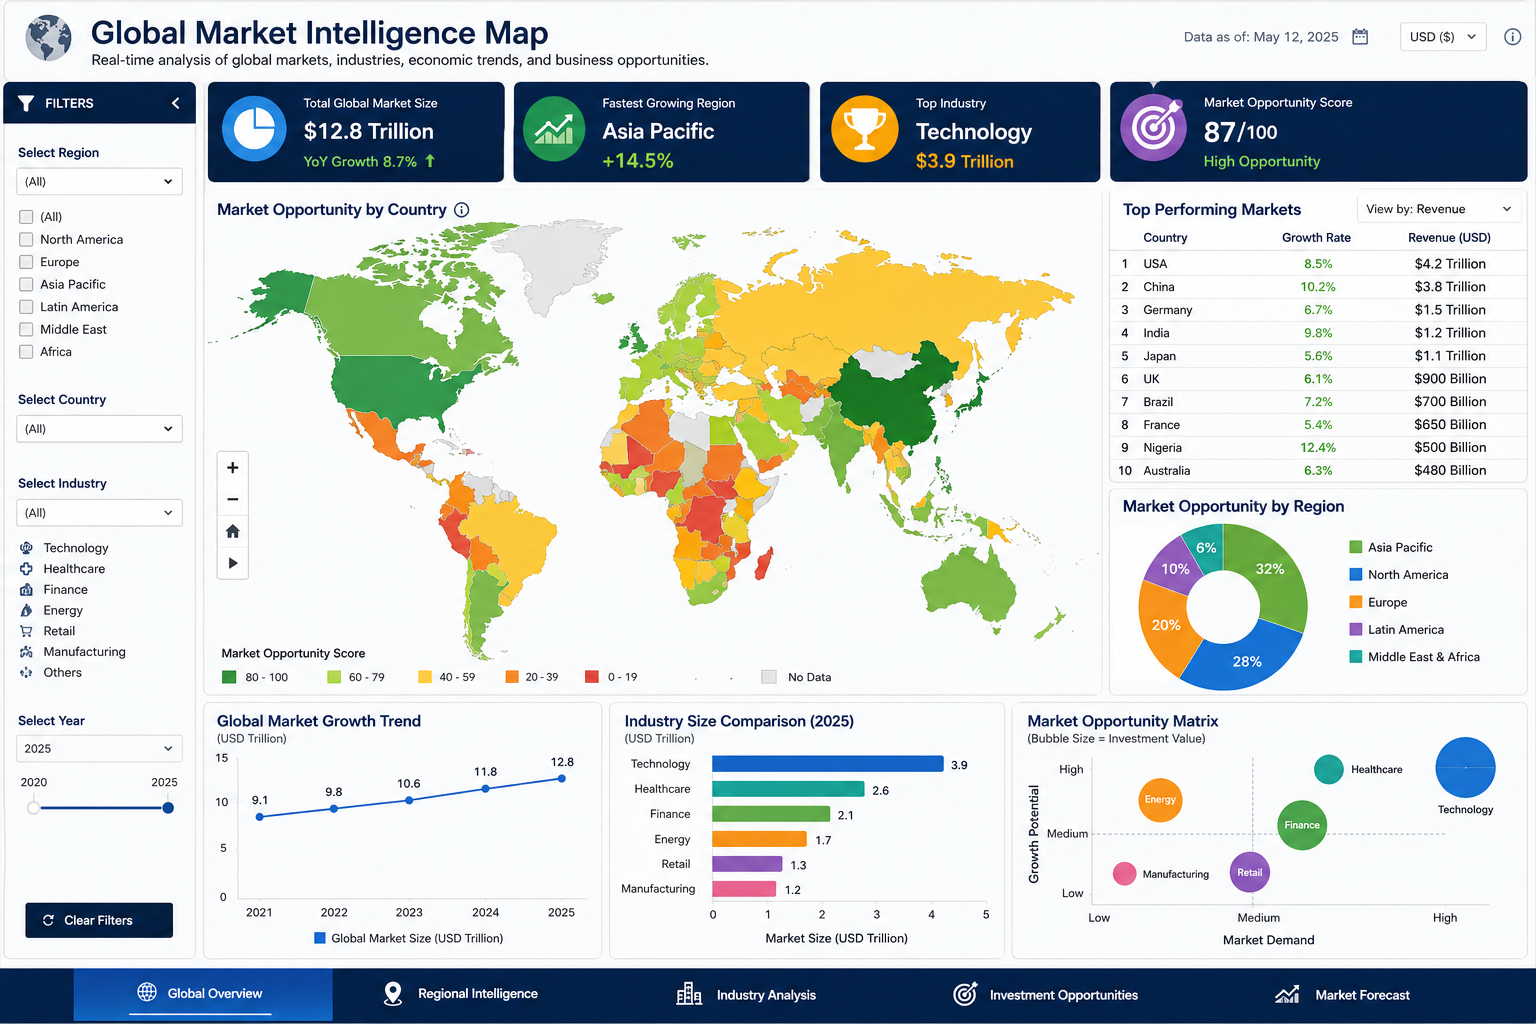
Download my full CV to see my experience, skills, and certifications in detail. Formatted for ATS compatibility and easy reading.
Last updated: June 2026
Martha consistently went beyond the brief. The sales dashboard she built wasn't just technically excellent — it changed how our leadership team runs weekly reviews. That's rare from someone just starting out.
One of the most diligent students in our Data Analysis Class . Martha asked the right questions, submitted projects early, and helped other her co-students debug their DAX formulas. A natural analyst and communicator.
Martha delivered our churn analysis two weeks early with a bonus recommendation deck we didn't even ask for. The Python model they built saved us real money. I'd hire them full-time without hesitation.
Available for full-time roles, freelance projects, and remote jobs.
Whether you have a role in mind, a data problem to solve, or just want to talk analytics — my inbox is open.